RSSBandit is an awesome RSS aggregator principally developed by Dare Obasanjo. I switched to RSSBandit after NewsGator and Outlook started having performance problems with the number of feeds that I was trying to process each day.
Last weekend I was subscribed to over about 1000 RSS feeds and conicidentally last weekend RSSBandit also became unusable. Obviously I had reached some kind of threshold that the architecture of RSSBandit wasn’t designed to cope with.
My first instinct was to ditch and go and find something a bit faster – after all it is a .NET application and we know how much of a memory hog those things are! Errr – hang on. Don’t I encourage our customers to go out and use .NET to build mission critical enterprise applications every day? I really needed to take a closer look at what was going on.
In idle RSSBandit takes up around 120–170MB of RAM on my laptop. Thats more than Outlook and SQL Server, and often more than Visual Studio (except when its in full flight) but to be honest I’m not that surprised because in order for it to give me the unread items count it has to process quite a few files containing lots of unique strings – that means relatively large chunks of being allocated just for data.
I decided to look a bit deeper and run the CLR Allocation Profiler over the code to see where all the memory (and by extension good performance was going). I remembered this article by Rico Mariani which included the sage words that “space is king” and while I waited for the profiler to download tried to guess what the problem would be based on my previous experience.
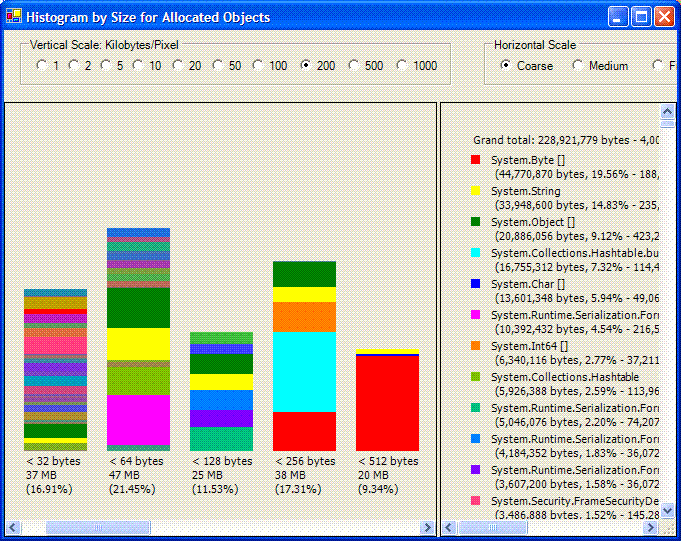
What I imagined was buckets of string allocations to store posts in their entirety and a significant number of XML related object allocations but when I looked at the allocation graph I saw something interesting.

The top four items on that list are 44MB, 33MB, 20MB and 16MB (roughly). I had actually expected to see System.String at the top of that list and with significantly more memory allocated – the histogram of allocated types wasn’t giving me the full picture.
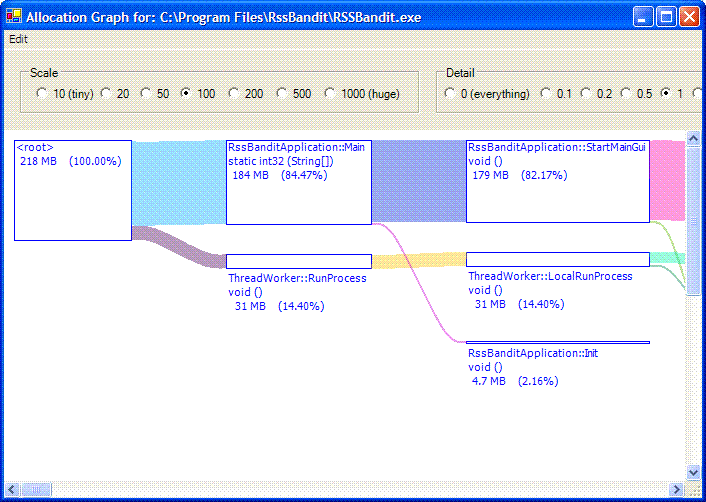
One of the things that I love about the CLR Allocation Profiler (and conincidentally something that I think it does better than any other tool) is the visualisation of the allocation graph. It allows you to see where memory was allocated in relation to the program code.

The above picture wouldn’t be that surprising if we were looking at a single threaded application because all the objects would be allocated on the main thread, although for multi-threaded applications that handle a bit of data you can expect to see some thicker lines heading away from <root>.
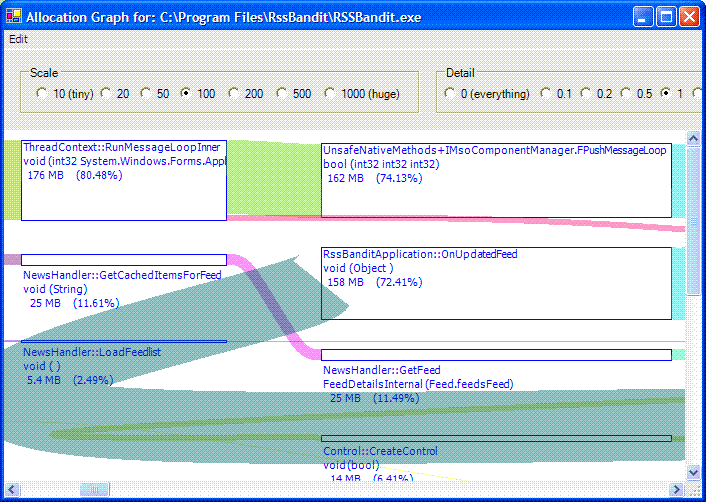
As I scrolled along I saw something that alarmed me – or at least something that I didn’t expect – there was quite a bit of memory traffic resulting from the OnUpdatedFeed method firing. Presumably this is to notify code in the application that some read/unread statistics have been updated for a particular feed.

OnUpdatedFeed probably fires off an event that multiple subscribers are listening to which is causing the object allocation. I guess architecturally its a reasonable approach provided the event doesn’t get fired too often but one of the issues with RSSBandit is that it recomputers its read/unread counts everytime you open the application and on an ongoing basis while you are using it.
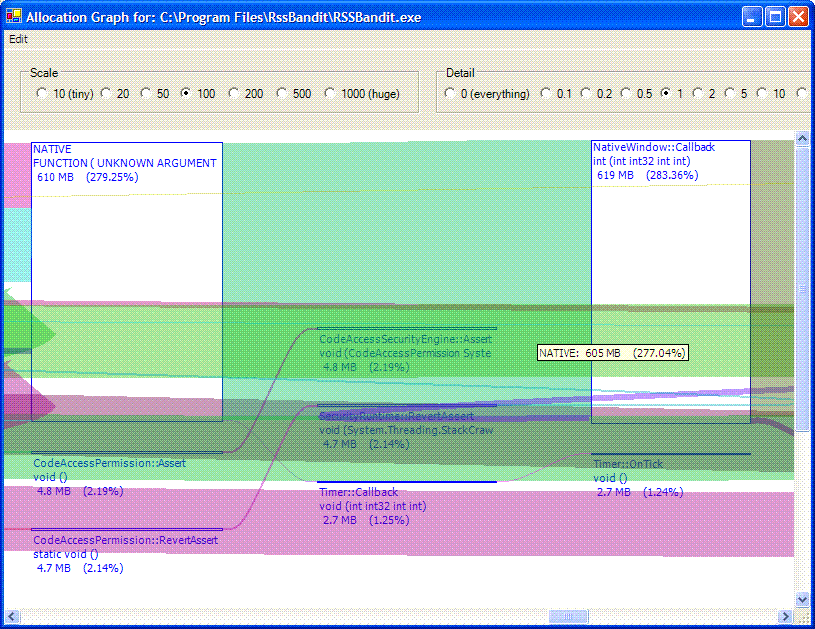
I decided to figure out what was causing the memory allocations so I continued moving along the line to see where the trail led me and I arrived at this little display.

As you can see there is a huge amount of traffic between this native function and the NativeWindow class. It was at this point that I started to suspect what the actual problem was and had to giggle at how many times this same problem pops up in smart client applications.
From what I can tell the problem is an excessive amount of marshalling to the UI thread is going on. This is causing threads to synchronise (tell tale DynamicInvoke calls are in there) and quite a bit of short term memory to be allocated over the lifetime of the application. Notice that there is 610MB of traffic between the native function and NativeWindow so obviously that memory isn’t hanging around.
The fix? I don’t know - but I suspect if I went in to the RSSBandit source and unplugged the UI udpates from the UpdatedFeed event the UI responsiveness would increase significantly (the background thread isn’t continually breaking into the main loop to update an unread count on a tree node).
I don’t mean to pick on Dare or RSSBandit here – this is actually a common problem in managed code when people try to build user interfaces which present constantly updating statistics to users. As a matter of fact we present a similar scenario to this (thread synchronisation) in our IS.NET course and lead students through the things they need to do to find the problem.
P.S. I’m going to party like its 1999!